Innovation in the Oil and Gas Industry: Tackling Methane Leaks
The Challenge
Methane leaks occur throughout the oil and gas value chain—from extraction and processing to transportation—due to equipment failures, operational losses, and accidental incidents. As a highly potent greenhouse gas, methane emissions not only result in the direct loss of a marketable resource but also contribute significantly to climate change.
According to estimates from the International Energy Agency (IEA), roughly 80% of methane emissions in the oil and gas sector originate from upstream operations, including hydrocarbon exploration and production. Approximately one-third of these emissions could be eliminated at no net cost, as the value of the recovered gas is comparable to—or even exceeds—the investment required to detect and repair leaks.
Several studies suggest that the majority of methane emissions come from just 2% of oil and gas facilities. However, these findings are based primarily on satellite observations, which can only detect large-scale emission events. As a result, the actual distribution of leaks across assets may differ significantly.
Economic Impact
Assessing the cost of methane leaks at the company or asset level is challenging because oil and gas operators typically do not report methane mitigation expenses as a separate line item in their financial statements.
On a global scale, the IEA estimates that methane abatement measures could recover approximately 81 million tonnes of gas annually in the oil and gas sector, along with an additional 43 million tonnes in the coal industry. Total industry spending on methane detection and mitigation reached an estimated $24 billion in 2025.
Methane emissions from fossil fuels in 2025
| Fuel Source | Emissions (tonnes/year) |
|---|---|
| Oil | 45 million |
| Coal | 43 million |
| Natural Gas | 36 million |
| Total | 124 million |
Source: Global Methane Tracker
Direct economic loss from lost gas
170 billion cubic meters of methane is equivalent to approximately 124 million tonnes.
| Gas Price | Value of 170 bcm of Gas |
|---|---|
| $150 per 1,000 m³ | $25.5 billion |
| $250 per 1,000 m³ | $42.5 billion |
| $350 per 1,000 m³ | $59.5 billion |
Structure of the LDAR market
| Region | Share | Market Size ($B) |
|---|---|---|
| North America | 50% | 12 |
| Europe | 21% | 5 |
| Asia-Pacific | 21% | 5 |
| Latin America | 4% | 1 |
| Middle East & Africa | 4% | 1 |
| Total | 100% | 24 |
Source: Global Leak Detection and Repair Sales Market Report
Standard Approach
The current method for detecting methane leaks relies on manual walk-through inspections of potentially problematic facilities using specialized equipment. An inspector moves sequentially along a process line, checking each individual component—such as valves, flanges, and connections—for signs of leakage.
Typically, two main types of sensors are used:
Optical Gas Imaging (OGI) cameras
Infrared cameras that visualize gas leaks as a “smoke-like” plume on a screen. They allow rapid scanning of large equipment from a distance, reaching up to around 3,600 components per hour.
Handheld “sniffer” devices (FID/PID / Method 21)
Portable instruments with a probe that must be placed directly next to each potential leak point. These provide precise quantitative measurements of gas concentration but are significantly slower, allowing inspection of up to about 200 components per hour.
Inspection frequency is typically quarterly for oil and gas facilities in regulated jurisdictions. The cost of inspections varies depending on the size of the facility and how difficult it is to access.
For OGI-based inspections, costs are roughly split between equipment rental and labor. For “sniffer” methods, the majority of costs are driven by labor.
Innovations
As an alternative to traditional manual inspections, three major technological directions are rapidly emerging: drones, satellites, and IoT sensors.
Drones
Drones equipped with gas sensors or OGI cameras can perform automated flyover inspections of facilities along predefined routes. Infrared cameras visualize methane leaks as a “smoke-like” plume on the screen, while laser or optical sensors measure methane concentration within the gas plume itself. Data can be transmitted to the operator in real time or analyzed after the drone lands.
Satellites
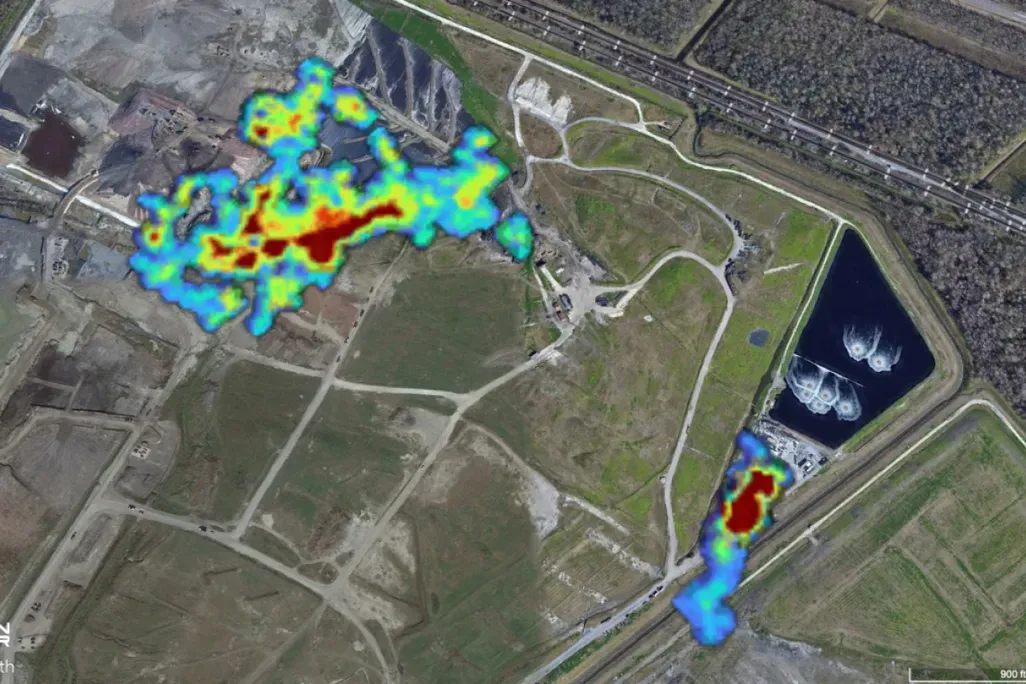
Hyperspectral and multispectral orbital sensors scan the Earth’s surface at intervals ranging from a few days to two weeks. Specialized instruments such as TROPOMI, Sentinel-5P, and GHGSat detect how methane absorbs sunlight, enabling calculation of gas concentrations in the atmospheric column above each location. This makes it possible to identify large leaks and their sources with an accuracy of tens to hundreds of meters.
IoT Sensors
Stationary gas detectors connected via cellular or radio networks are installed directly on high-risk components (such as flanges, valves, and pipelines) or around the perimeter of a facility. Each sensor continuously monitors methane concentrations with high sensitivity and automatically sends an alert to a control center when a threshold is exceeded. Leak localization can be further improved using networks of multiple sensors and triangulation techniques.
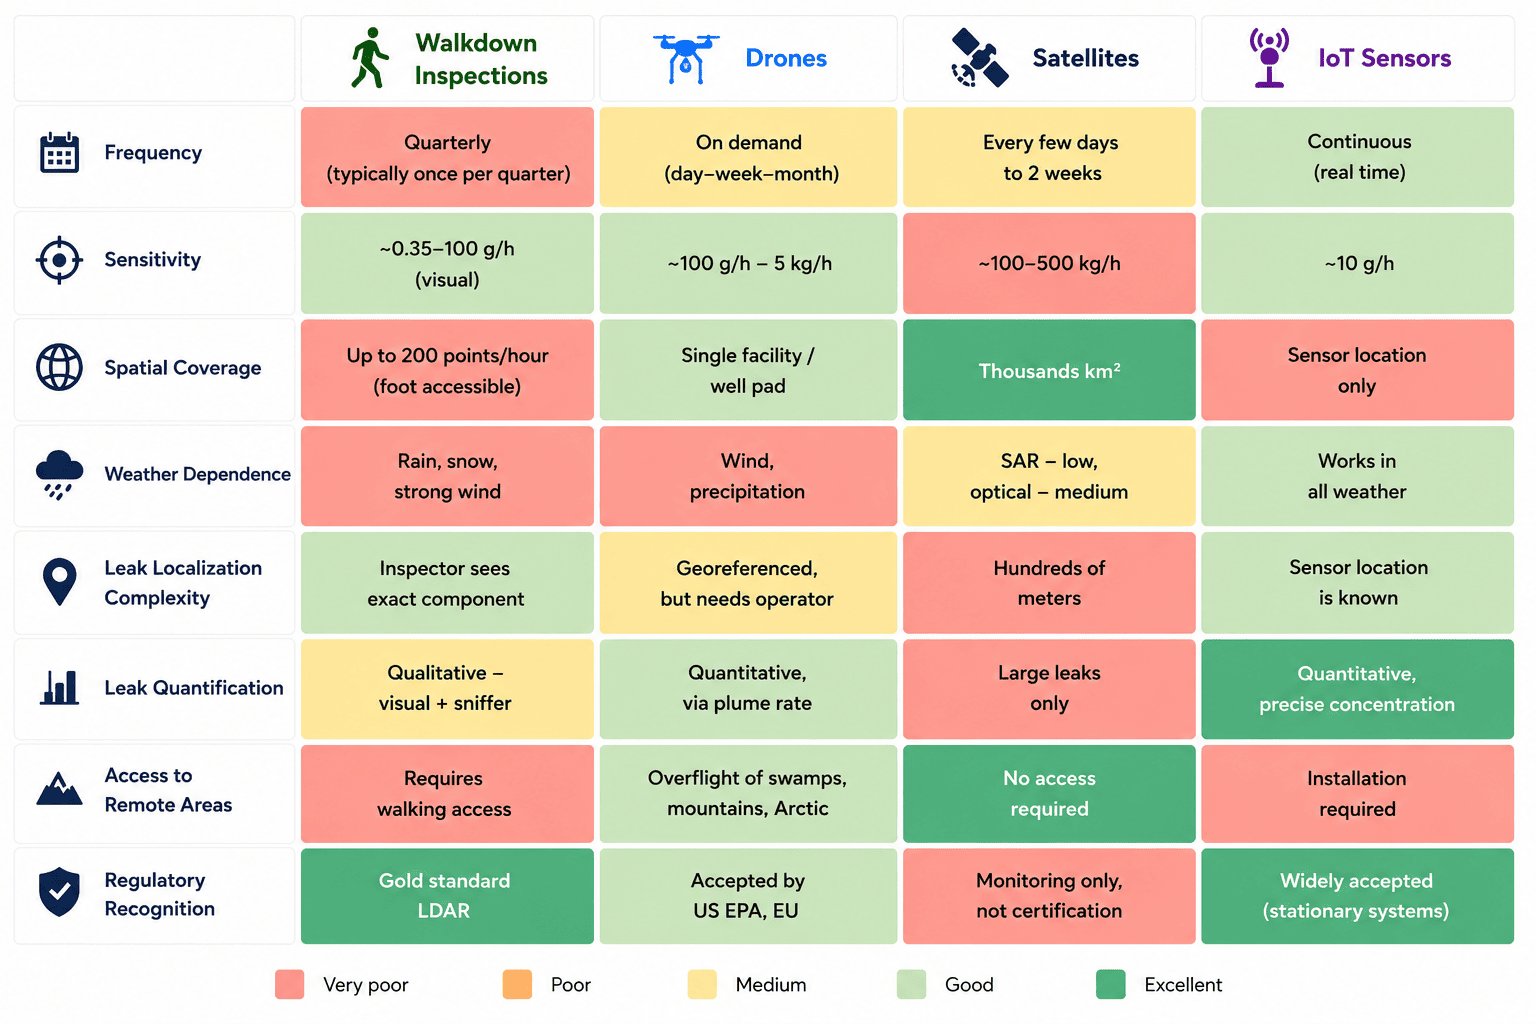
Comparative Analysis
The core idea behind these alternative approaches is:
- shifting from periodic manual inspections to automated monitoring
- reducing response time when leaks occur
- lowering labor costs
- improving detection of hard-to-access facilities
Below are tables comparing these alternative methods with each other and against the baseline approach (i.e., manual walk-through inspections).
Startups in Methane Leak Monitoring
The main investment focus in this space is on drones and sensor-based systems. Satellite-based methane emissions analytics remains a relatively niche segment of the industry.
Percepto
Develops autonomous drone-in-a-box systems equipped with integrated OGI cameras for quantitative methane leak detection. The drone remains permanently on-site, enabling daily monitoring without requiring personnel in the field.
[Founded 2014, $128M total raised]
Momentick
Provides satellite-based methane emissions monitoring using multispectral imagery. The company applies AI-driven algorithms to detect and quantify emissions, and can localize sources down to individual facilities.
[Founded 2020, $14M total raised]
XMТrace
Integrates networks of stationary sensors with autonomous drones to enable continuous monitoring. Smart perimeter sensors trigger drone deployment only when emissions are detected, reducing operational costs.
[Founded 2025]
Insight M
Offers aerial methane monitoring using small aircraft equipped with spectrometers. The system can detect emissions from 10 kg/hour, localize sources, and provide quantitative estimates of release rates.
[Founded 2014, $131M total raised, acquired]
Bridger Photonics
Develops airborne laser LiDAR systems for quantitative methane leak detection. Mounted on aircraft or drones, the technology enables source localization with up to 2-meter accuracy, estimates emission rates in kg/hour, and visualizes gas plumes.
[Founded 2006, $63M total raised]
eLichens
Produces miniaturized NDIR sensors for continuous methane leak monitoring. Its P2M50 EmiVolta stationary sensor system detects emissions as low as 0.1 kg/hour, localizes sources with up to 1-meter accuracy, and automates reporting in line with OGMP 2.0 standards.
[Founded 2015, $28M total raised]
NanoChronia
Develops graphene- and perovskite-based nanosensors for real-time IoT monitoring of methane, hydrogen, ammonia, and hydrogen sulfide leaks. Still in an early stage, the company has already attracted interest from major players such as the Repsol Foundation and participates in government-funded research programs.
[Founded 2023, $300K total raised]